Executive Summary
What if you could identify all the ways in which your organization is exposed to cyber attacks, understand how adversaries will exploit those exposures, and prioritize remediation efforts to reduce risk most effectively? Well, that is exactly what this report is all about.
This report presents key insights drawn from hundreds of thousands of attack path assessments conducted through the XM Cyber Continuous Exposure Management (CEM) platform during 2023. These assessments uncovered over 40 million exposures affecting 11.5 million entities deemed critical to business operations. Data gathered from the XM Cyber platform were anonymized and provided to Cyentia Institute for independent analysis to generate the insights that fill the pages to follow.
Everyone’s talking about exposure management
Exposure Management seems to be the hot topic on everyone’s lips right now, but defining what this means and how best to implement a Continuous Threat Exposure Management (CTEM) framework is still causing some confusion.
Aiming to move away from the pain point of endless lists of vulnerabilities, organizations are embracing technologies that claim to provide greater coverage of exposure types, and additional context to aid the prioritization and risk analysis of these different exposure types, however, the context is still often limited to each individual asset or focused solely on the intrusion risk, as in which asset is the mostly likely breach point.
At XM Cyber we’ve been providing holistic Exposure Management powered by our XM Attack Graph Analysis for over 8 years. We’re proud to once again distill those findings into this third edition of our annual State of Exposure Management report. We hope these insights will bolster your security team’s important mission over the next year.
We present some highlights of this year’s analysis on the next page.
Key Findings:
- Exposure Management is much more than just CVEs.
Organizations typically have about 15,000 exposures across their environments that attackers could exploit. Traditional CVE-based vulnerabilities account for less than 1% of those and just 11% of all exposures to critical assets. - Effective exposure management needs to integrate attack path modeling.
XM Attack Graph Analysis™ identifies that 2% of exposures reside on “choke points” of converging attack paths that adversaries can use to reach critical assets. There’s a 20x difference in choke point ratio between organizations with the worst vs. best security posture. - Identity and credential issues represent a huge exposed attack surface.
Active Directory typically accounts for 80% of all security exposures identified in organizations as well as one-third of their issues that put critical assets at risk. - Poor cyber hygiene plagues the security of endpoints.
79% of organizations have problems with cached domain credentials or local credentials that are present on multiple machines across the network. While most organizations use EDR (91%), over a quarter of devices aren’t typically covered. - Cloud environments are not exempted from the risk of exposure.
Over half (56%) of critical asset exposures are in cloud platforms. Furthermore, attackers can traverse on-premises to cloud environments in 70% of organizations and then compromise 93% of critical assets in the cloud in just two hops. - One size doesn’t fit all for managing exposures. The report also highlights some key findings across different industry types and sizes.
On average, financial firms manage 5x more digital assets than the energy sector, but the proportion of exposures affecting critical assets is 21x higher in the latter. - Exposure management can’t be a one-time or annual project.
It’s an ever-changing, continuous process to drive improvements. Organizations with
poor XM Cyber posture scores have six times the number of security exposures
(30k) compared to high scorers (5k). What’s worse is that the gap between those
groups widened over time.
Measuring Security Posture
We’ll soon dig into our detailed analysis of attack paths, but let’s first set the stage with an overall assessment of organizational risk exposure. The XM Posture Score™ provides such a view.
XM Cyber evaluates the risk to critical assets for various attack scenarios, each of which receives a score from 0 to 100. This score is based on the number and complexity of paths leading to critical assets in that scenario. A lower score indicates higher risk due to numerous shorter, simpler attack paths. Higher scores signify the opposite; critical assets are less susceptible to compromise. Scores for all scenarios are averaged to derive the overall security score for the organization.
Figure 1: Organizations with the highest (blue) and lowest security scores (red)
Figure 1 shows the distribution of security posture scores for individual organizations as of their latest assessment in 2023. Those earning the highest 25% of scores are indicated in blue and can be considered top performers. Organizations in red ranked in the lower 25th percentile of scores. The middle half of organizations is faded out to draw more contrast between the top and bottom performers. The median score across all organizations is 79.
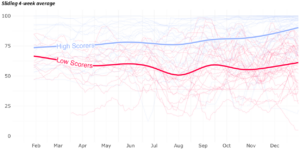
The “as of their latest assessment” caveat brings up an important point—security scores are not static over time. Per the faded lines in the background of Figure 2, they shift up and down as changes in the environment and evolving attack scenarios alter risk to critical assets. The moving average among both high- and low-scoring organizations is fairly steady but grows apart over time. The high scorers show steady improvement during the year, while low-scoring organizations trend down.
Cyber risk can’t be a one-time or annual project. It’s an ever-changing, continuous process to drive improvements.
Figure 2: Daily security scores with moving averages for high- and low-scoring organizations
This serves as a very visual reminder that managing cyber risk can’t be a one-time or annual project. It’s an ever-changing, continuous process to drive improvements. Now let’s dig into those attack path details we promised.
A Primer on Attack Paths
Organizations face a constant threat of cyber-attacks that can jeopardize critical assets, exfiltrate data or disrupt business operations. Although these cyber attacks are ever-evolving, they typically follow a logical set of steps referred to as the Cyber Kill Chain, which provides an effective structure for an adversary or attacker to breach an organization’s defenses. Whereas the Kill Chain represents the individual stages of an attack, the term Attack Path refers to the logical path across your network and around your different security defenses that the attack takes in order to execute their kill chain and reach the end goal of your business-critical assets and systems.
The attack path is formed of individual hops between many different entity types, across all parts of your enterprise infrastructure. They stretch from edge-of-network devices and perimeter defenses, spreading laterally through laptops, desktops and workstations in the campus. They can traverse vertical network layers from physical, to virtual and cloud entities, and can even traverse the vertical layers of data plane, to the control plane to the management plane and back again. Attack paths aren’t just formed from different device types, but can leverage extended entity types, like software applications, kubernetes clusters, user credentials, API tokens, and other identity types.
Due to this expansive array of entity types and infrastructure layers, it’s difficult to truly understand the risk varying attack paths present. Considering only one type of exposure, such as vulnerabilities (CVEs), or one infrastructure layer, such as cloud, severely limits your ability to see the full extent of the exploitability of your attack surface and the potential attack paths towards your critical assets.
To help address this challenge, Attack Path Modeling is a foundational methodology needed for Exposure Management. It helps cyber defenders and security stakeholders identify and map potential routes that threat actors could take to exploit vulnerabilities, misconfigurations and weak security posture in order to compromise critical assets.
But why limit this model to only a single Attack Path?
XM Cyber has pioneered the use of Attack Path Modeling for Exposure Management since its inception. However to truly see all ways an attacker could breach your organization, you need to see all attack paths from a holistic viewpoint and in a comprehensive state.
Introducing XM Attack Graph Analysis™
XM Attack Graph Analysis™ gives you clear and concise exposure intelligence, built from context-based insights across all exposures from Cloud to Core, by pinpointing key intersections where attack paths converge and present the most critical risk to business operations. This helps Security and IT teams prioritize remediation efforts, and work collaboratively to have a positive impact on security posture and a reduction to cyber risk.
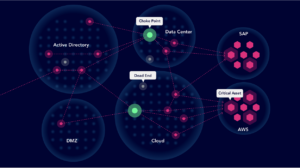
Figure 3: Example attack graph identifying entities, dead ends, choke points, and critical assets
Understanding the relationship and context of attack paths toward critical assets is essential to mitigating risk. By visualizing all possible attack paths through the XM Attack Graph Analysis™, the platform can correlate all validated attack paths, to uniquely identify the key intersections where attack paths converge and highlight them as Choke Points that present the most impactful risk to your critical assets.
By identifying entities with the weakest and most exploitable security posture, we can assess the intrusion risk and most likely breach points to your organization. Our attack scenarios continuously calculate all potential attack paths from the breach point through to the critical assets. This in turn allows for a more validated approach to risk prioritization that reports all attack tactics, techniques and processes (TTPs) that the attacker could utilize, in order to exploit the specific exposures of each entity along the attack path.
The analysis and statistics shown in this report are all taken from the XM Attack Graph Analysis™, leveraging the key metric of critical assets at risk, presented by a particular exposure type, or attack TTP.
Our advanced approach to attack path modeling gives you the context you need to make faster, more confident decisions about your exposure risk profile, and where to focus your remediation efforts. Continue reading this report for unique insights taken from the XM Attack Graph Analysis™.
Enumerating Exposures
Data collected from attack path assessments continually points to a core cybersecurity challenge facing every organization: there are just too many issues for defenders to realistically fix and too many ways for attackers to exploit them. Even the best teams become overwhelmed.
We typically identify 15,000 exposures attackers could exploit in each organization. Some have over 100,000!
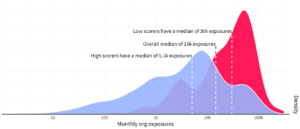
“Overwhelmed” is rather vague, so let’s put some numbers around that in Figure 4. We typically identify 15,000 security exposures that attackers could exploit in each organization on a monthly basis (that’s the overall median). The median among organizations with high overall security posture scores is just 5,000, while low scorers contend with six times that amount!
Figure 4: Distribution of attack path exposures identified across organizations
Entities: Any endpoint, workstation, server, identity, access tokens, cloud resources, etc. in an environment that an attacker can use to advance an attack path toward critical assets.
Exposures: Exposures are combinations of techniques and entities susceptible to those techniques. They essentially enumerate the many options attackers have at their disposal.
Points of Convergence
Rather than treating all exposures equally, a far more manageable approach is to identify the subset of issues that represent the highest risk and prioritize those for remediation. The majority (74%) of security exposures afflicting organizations are on “dead ends” that limit attackers’ lateral movement toward critical assets.
The majority (74%) of exposures are on dead ends that limit attackers’ lateral movement toward critical assets.
A small subset of exposures, however, affect critical assets and/or represent “choke points” of converging attack paths that adversaries can leverage to escalate and broaden their access through the target environment. Defenders can also target those same choke points to reduce risk more efficiently and effectively.
Dead End: An isolated exposure that does not lie on a path to critical assets. Fixing dead ends will not lead to significant risk reduction and comes with high opportunity costs.
Choke Point: A key entity where multiple attack paths converge before reaching critical assets. Fixing choke points severs multiple attack paths at once for efficient risk reduction.
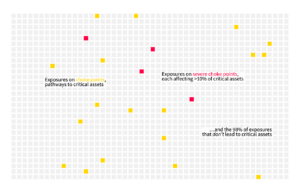
This concept is depicted in Figure 5, which represents the typical enterprise attack surface. Choke points and directly exposed critical assets are highlighted in yellow and red amid the sea of all exposures. We distinguish the red ones because about 1 in 5 choke points exposes 10% or more of the critical assets in the organization. Compromising those opens the door for attackers to cause severe impact. Addressing these should be at the absolute top of your security remediation to-do list.
~2% of exposures affect critical assets and/or represent choke points of converging attack paths that adversaries can leverage to escalate and broaden their access.
Our last report placed the typical ratio of choke points to exposures within organizations at about 2%. In the interim year, we conducted tens of thousands of additional assessments of a significantly larger population of organizations, which reestablished a similar ratio (1.5%).
We feel obligated to stress that this doesn’t mean the remaining supermajority of exposures don’t matter or shouldn’t be fixed. They are security issues and they do enable attackers to persist in the environment. That said, remediation has to start somewhere. And we suggest focusing first on the exposures that matter most—and that’s clearly critical assets and choke points. This is the power of the XM Cyber approach to exposure management—98% reduction in effort for maximum risk reduction efficacy!
Figure 5: A depiction of the typical attack surface, showing the ratio of “choke points” (yellow and red squares) among all identified exposures (gray squares).
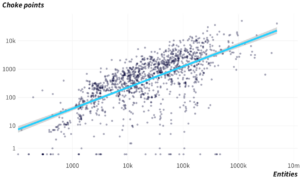
In addition to updating the choke point stat based on the latest and greatest data, we thought it would be instructive to explore how much variation exists among firms. Each dot in Figure 6 plots an organization’s entities (x-axis) and choke points (y-axis) in a given month. The overall trend remains fairly steady regardless of how many entities are present, but the choke point ratio does vary substantially among organizations.
This is the power of the XM Cyber approach to exposure management—98%+ reduction in effort for the same level of risk reduction!
Figure 6: Variation in the ratio of choke points to entities among organizations
Practically speaking, that means some organizations will find it significantly harder (or easier) to efficiently stop attack propagation than others. This should not be surprising, since all environments contain a different mix of assets, data, configurations, controls, etc. It reinforces the importance of knowing your environment and understanding its strengths and weaknesses relative to attackers’ ability to cause harm.
The choke point ratio varies substantially among organizations, which means some will find it harder to efficiently stop attack propagation than others.
Organizational Comparisons
Figure 7 demonstrates the effect that your environment has on attack paths. It compares key exposure statistics between organizations with the highest and lowest security posture scores. Low scorers typically have 6X more exposures and a 23X higher ratio of choke points. That doesn’t mean their risk fate is sealed, but it does suggest the starting point and the effective mobilization of exposure management matters quite a bit.
Figure 7: Comparison of exposure statistics for organizations with high vs. low security scores
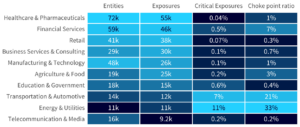
We offer a similar comparison among industries in Figure 8. Let’s start with the number of digital entities detected in the first column. From this, we see that the Healthcare & Pharmaceuticals, Financial Services, Manufacturing & Technology, and Retail sectors tend to manage environments that are larger and more complex than many other types of organizations. These industries traditionally have many digital assets to track and protect.
Critical Exposures: Exposures that have been validated to be exploitable and present an onward attack path towards critical assets using the XM Attack Graph Analysis(™).
In general, industries that have a lot of entities also have a lot of exposures. This makes sense because entities vulnerable to attack are, by definition, exposures. The fact that the median number of exposures affecting healthcare providers is 5X that of the Energy and Utilities sector points to the inherent challenges of minimizing risk in those environments.
Figure 8: Comparison of exposure statistics by sector
Speaking of minimizing risk, the third column offers a more risk-centric perspective. It shows the proportion of all exposures that put critical assets at risk. The tables are turned here, and we see unusually high ratios of critical exposures for the transportation and energy sectors. A similar pattern applies to the choke point ratio. The lower exposure count in the denominator contributes to that calculation, but the basic fact remains. Managing high concentrations of critical assets and choke points requires a different approach than risk-sparse environments.
Finding & Categorizing Exposures
We’ve explored challenges associated with the high volume of security exposures across enterprise environments, but important questions remain. Where do all these exposures exist? How do attackers exploit them? What attack techniques can cause the most harm? In this section, we’ll seek those answers and more.
To a certain extent, answers to these questions are a matter of perspective. Many view their attack surface as consisting of everything in their environment. And there’s truth to that; organizations should protect all their assets. But to do that effectively, they need to know where those assets are located and how they’re exposed to attack.
Where/What are our biggest exposures? Well, the answer depends on how you define “biggest…”
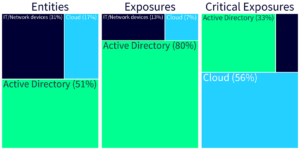
The leftmost chart in Figure 9 represents the attack surface based on broad categories of digital entities discovered during XM Cyber’s attack path assessments. Active Directory constitutes just over half of entities identified across all environments. On-premises IT and network devices account for another 31% of entities and cloud environments house the remaining 17%.
Not all entities, however, are exposed via attack paths. If we change the scope of the attack surface to include only vetted exposures (entities susceptible to attack techniques), things look different. The middle chart captures this perspective and Active Directory exposures dominate the attack surface.
Exposure management must encompass all environments and account for where critical assets are most at risk.
But not all of those exposures affect critical assets. To be truly effective, exposure management must encompass all environments and account for where critical assets are most at risk. If we once again rescope the attack surface to focus on exposures to critical assets, a very different picture emerges, which is captured in the rightmost chart of Figure 9. Cloud environments now encompass over half of all critical asset exposures, followed by AD at 33% and IT/Network devices at 11%.
Figure 9: Categorical breakdown of entities, exposures, and critical exposures
Given that defenders often specialize along lines which are not too different from these high level categories, an organization could find itself adequately staffed and skilled to manage entities based on their overall counts, but coming up short when managing the outsized impact presented by riskier—albeit less numerous—ones. With too many entities and too little time, weeding out benign exposures is crucial to matching effort to risk.
Active Directory is the largest attack surface, but the largest share of exposures to critical assets is in the cloud.
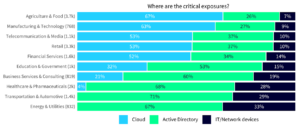
We compare the relative distribution of exposures to critical assets across industries in Figure 10. About half follow the overall pattern of Cloud > Active Directory > IT/Network devices. But there’s quite a bit of variation and some sectors buck that trend entirely. For example, very few of the critical asset exposures affecting the Energy, Transportation, and Healthcare sectors are in the cloud. On the other hand, the share of critical exposures in cloud environments is much higher than average in the Agriculture and Manufacturing industries.
Figure 10: Categorical breakdown of entities, exposures, and critical exposures by sector
The distribution of critical exposures for organizations of different sizes is revealed in Figure 11. Cloud infrastructure represents the largest share for all groups but the extent of that majority varies among them. Interestingly, the highest concentration of exposed critical assets in the cloud are seen in the smallest and largest organizations.
Figure 11: Categorical breakdown of entities, exposures, and critical exposures by organization size
At this point, you may be wondering how attackers can exploit these exposures in on-prem infrastructure, cloud, and Active Directory. Since each of those environments often involve different teams and skillsets to manage them, we’ll explore each individually in the sections that follow.
Exposures in IT/Network Devices
The IT/Network devices category wasn’t the largest in any of the breakdowns we showed in the previous section for entities, exposures, and critical exposures. But we’ve chosen to start here anyway because many organizations in our sample operate predominantly on-premises infrastructure. Plus, even among those with extensive cloud environments, enterprise networks are often the starting point for exposure management.
Hops to compromise on-prem assets
Enterprise networks can be complex labyrinths, but that doesn’t mean attackers can’t navigate quickly through them. Our attack path assessments mimic how attackers do this to better understand the difficulty involved. Generally speaking, organizations want to make attack paths as difficult and convoluted as possible to hinder lateral movement and compromise of critical assets. Unfortunately, that’s not typically what we find.
Hops: Steps taken by attackers from the point of initial foothold to compromising critical assets. Hops consist of various techniques used to exploit vulnerable resources, which become the staging ground for the next hop.
Over 60% of critical assets can be compromised in just a single hop from the initial point of intrusion into on-prem networks. Successive hops bump that to 65% (2) and 73% (3), and after four hops in, 80% of all critical assets are reachable. This escalating scope of compromise is captured in Figure 12.
62% of critical assets can be compromised in just a single hop from the initial point of intrusion into on-prem networks.
We suspect these numbers will seem high to many readers. But this is largely the result of choke points; they enable attackers to move quickly through the environment. That’s why remediating those choke points is so effective in restricting access and reducing risk.
Figure 12: Scope of critical assets at risk with each additional hop along on-prem attack paths
Top on-prem attack techniques
Some may assume attackers primarily exploit traditional CVE-based vulnerabilities to execute hops and move about the environment. CVEs definitely contribute to this but they’re not the biggest factor identified during our attack path assessments.
Although XM Cyber is able to identify all CVEs on endpoint devices, they do not all factor into the XM Attack Graph Analysis(™). Each attack scenario focuses extensively on remotely-exploitable vulnerabilities that can be used by attackers to spread either laterally or vertically to other entities along the attack path. The attack techniques that are deemed to be successful in propagating the attack are then reported on a per technique or per entity basis to simplify remediation efforts. We found exploitable vulnerabilities in most organizations (86%) but they accounted for less than 1% of all exposures and 11% of critical exposures.
Figure 13: Prevalence of exposures associated with exploitable vulnerabilities (CVEs)
The most common CVE among attack paths was CVE-2021-34527 (aka “PrintNightmare”). A cluster of CVEs associated with file loaders targeting Microsoft Office Documents used in multiple campaigns exposed the largest percentage of critical assets (e.g., CVE-2021-40444). Such vulnerabilities definitely contribute to the ability of attackers to compromise critical assets and should be remediated. But exposure management obviously must be much broader than CVEs to adequately manage risk.
Remote-exploitable CVEs accounted for less than 1% of all exposures and 11% of critical exposures.
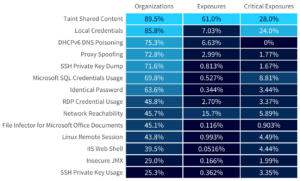
That begs the question of what techniques account for the bulk of exposures and Figure 14 supplies the answer. There are two biggies from a critical assets perspective: Taint Shared Content and Local Credentials.
Figure 14: Top IT/Network techniques identified by attack path analysis
The first technique involves attackers “tainting” files in shared folders with malicious code. When users access those shared files, the code executes, allowing adversaries to compromise remote systems and move through the network. This is widely considered to be bad practice and difficult to solve at scale, which is why it remains a top issue. There is a MITRE ATT&CK technique under the same name with more details and examples. The DFIR report also provides examples of this technique.
Attack techniques associated with local credentials are a big problem, identified in 86% of organizations and behind 24% of critical exposures. This issue generally entails common or shared accounts created locally on multiple devices, which introduces a high risk of compromise.
Attack techniques associated with local credentials affect 86% of organizations and 24% of critical exposures.
Even worse, 24% of organizations have what we suspect are “golden image” issues wherein local credentials are present on more than 10% of devices. This often occurs unintentionally as the credential-laden golden image is replicated across many desktops and servers, exposing them to compromise.
EDR coverage and efficacy
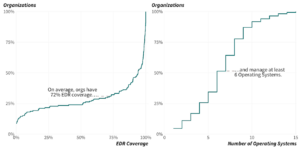
Endpoint Detection and Response (EDR) solutions aren’t limited to on-prem IT infrastructure but that’s the traditional use case. Most (91%) of the organizations we assess have EDR deployed and the average coverage across in-scope devices is 72%. That, of course, means over a quarter of endpoints aren’t typically covered by EDR.
Most organizations we assess have EDR deployed and the average coverage across in-scope devices is 72%.
Figure 15: Scope of devices and number of operating systems covered by EDR
Does EDR make attack paths more difficult? There’s some evidence for that, yes. But it’s probably not as strong as you may expect because EDR, at least among the organizations we analyze, is table stakes (see Figure 15). Plus, attacks that bypass EDR are becoming more common and effective.
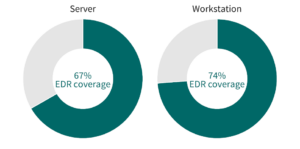
Per Figure 16, EDR coverage tends to be slightly more comprehensive for workstations than servers. The workstation statistic would be even higher if not for the traditional lower coverage rates for non-Windows devices. We find the fact that one-third of servers fall outside the protection of EDR particularly concerning since servers are generally considered higher-risk assets than workstations.
The variety of operating systems covered by EDR in the organizations we analyzed is quite high. Half of organizations run at least six different OS and 16% manage more than 10. This is a good reminder of the coverage challenges with OS-specific EDR tools.
Figure 16: Comparison of average EDR coverage for servers vs. workstations
Organizations with the highest overall security posture scores have somewhat higher EDR coverage (average 76% of devices), but the lowest scorers have extensive deployments, too (average 67%). EDR is not the fail-safe line of defense that many think it is. Partial deployments, improper configuration, and management challenges are the norm. Unfortunately, these issues allow attackers to bypass this presumed last line of defense without much resistance.
Figure 17: Comparison of average EDR coverage for organizations with high vs. low security scores
Exposures in Cloud Environments
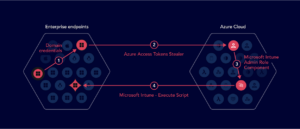
Before analyzing attack paths IN the cloud, let’s first recognize that many of those paths originate on-prem. For example, the attack path in Figure 18 starts from an enterprise workstation. After exploiting domain credentials, the attacker pivots into the cloud environment by harvesting valid Azure access tokens (claimed with MFA). The attacker is then able to escalate privileges and compromise an Intune (Azure MDM solution for managing devices) Administrator User. Abusing the permissions of that user enables code execution back on the enterprise machines and further lateral movement.
Figure 18: Example attack path for traversing enterprise and cloud environments
During attack path assessments over the last year, we found exposures in 70% of organizations that allow attackers to pivot between enterprise networks and cloud environments. That rate varies among the “Big 3” providers, Amazon Web Services (AWS), Microsoft Azure, and Google Cloud Platform (GCP), as shown in Figure 19.
Figure 19: Organizations with exposures enabling attackers to gain access to cloud resources
Of course, pivoting from on-prem networks isn’t the only way attackers infiltrate cloud platforms. For example, over a quarter of firms (26%) have public-facing virtual machines that expose critical assets. Such exposures circumvent the need to compromise enterprise networks first.
We found exposures in 70% of organizations that allow attackers to pivot between enterprise networks and cloud environments.
Hopping on clouds
Per Figure 20, attack paths in the cloud are much shorter than on-prem. After gaining initial access to a cloud environment, attackers can compromise 88% of critical assets in a single hop. 96% after just 3 hops.
Figure 20: Scope of critical assets at risk with each additional hop along cloud attack paths
After gaining access to a cloud environment, attackers can compromise 88% of critical assets in a single hop.
Why do cloud attack paths offer a fast-track to critical assets? Part of the reason is that cloud security practices are still relatively immature in many organizations. Managing identities and permissions in cloud environments can be very different from their equivalents for enterprise infrastructure. Mistakes are common and many teams aren’t trained on how to spot them.
Top cloud attack techniques
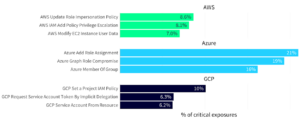
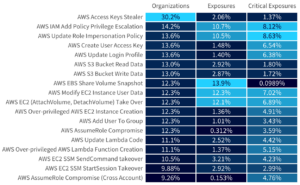
Appendix B lists the top techniques identified for attack paths in each cloud platform based on prevalence across organizations, total number of exposures, and critical assets at risk. Since that makes for a rather lengthy list, we highlight the three that grant the highest exposure of critical assets in Figure 21. A few observations stand out to us.
Figure 21: Top techniques identified by attack path analysis for AWS, Azure, and GCP
First, we note that attack techniques differ for each cloud platform. This is not a result of simply naming things differently. Each platform supports different configurations and comes with their own set of best practices. Each requires dedicated knowledge and skills to properly defend against attacks. The expanded list of platform-specific techniques in Appendix B reinforces this.
That said, we do find some common themes here. Most of these cloud attack techniques target credentials and privileges. Though each cloud has its own constructs and object types around identity, credentials, and access rights, they all suffer from misconfiguration issues. The complexity with identity management in cloud specifically is opening a new technology market for Cloud Infrastructure Entitlement Management (CIEM) as an extension to Exposure Management for the Cloud.
Our third and final observation related to Figure 21 derives from the first two. If attack techniques and configuration requirements differ among cloud platforms, then exposure management becomes even more difficult (and important!) in multi-cloud environments.
Want to know more about attack paths in the Cloud?
Review our Continuous Exposure Management for the Cloud Use Case pages, to find out how you can gain holistic visibility and analysis for end-to-end exposure management. Or download our new eBook The Power of Attack Paths in Cloud.
Exposures in Active Directory
Active Directory is the key to your network, responsible for connecting users with network resources—but it’s also a prime target for attackers. An attacker who has compromised an Active Directory account could use it to elevate privileges, conceal malicious activity in the network, execute malicious code, and even gain access to the cloud environment.
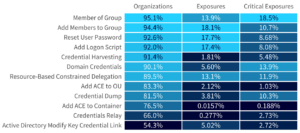
As we saw in an earlier section, Active Directory accounts for a huge proportion (80%) of security exposures across the typical enterprise network. Top attack techniques associated with those exposures are listed in Figure 22. Scanning the list reveals two broad categories of issues: misconfigurations and credential attacks.
Many of these exposures stem from the inherent nature of dynamic configuration issues in Active Directory as well as the challenge of keeping it updated. This creates a blind spot that appears secure on the surface but hides a nest of problems that many security tools can’t see. For example, issues related to managing members and resetting passwords in Figure 22 present a challenge for nearly every organization.
Figure 22: Top Active Directory techniques identified by attack path analysis
Numerous high-profile attacks exploit credentials, which means adversaries go to great lengths to compromise them. That’s why techniques like credential harvesting, dumping, relay, and domain credentials feature prominently in Figure 22. Tools like Mimikatz make these techniques even easier to execute and are extremely popular.
Poor practices also make credential-related attack paths easier and more harmful. For example, we identified highly privileged Active Directory credentials cached on multiple machines in 79% of organizations. About 5% of Active Directory users have cached credentials and one in five of those have admin-level permissions on 100 or more devices.
Download this handy checklist to make sure you’re following best practices and keeping your organization’s Active Directory safe from threats.
Conclusion
- Holding for input from XM Cyber team re conclusion
- Do you want to include recommendations or a call to action?
- We could recast the Exposure Management intro section as a concluding statement about the CTEM market and why they should care.
Appendix A: Security Posture Scores by Sector
Comparing overall security scores across industries in Figure A1 reveals some notable differences among them. We’ll highlight three sectors that piqued our interest and leave readers to mull over scores for industries most relevant to them.
The Financial Services sector, which often ranks high for strong security posture, actually sits in the middle of the pack as measured here. While it’s true that many financial firms have ample resources, they also tend to have high concentrations of critical assets that attract motivated attackers.
Figure A1: Comparison of overall security scores by sector
Healthcare institutions face numerous challenges when it comes to cybersecurity, and that fact is reflected in the relatively low security score for that sector. Those curious about the anatomy of attack paths in Healthcare can review two short case studies in this blog post from XM Cyber.
Finally, the Business Services industry warrants mention. Since such firms’ primary mission is serving other organizations, their lower-tier score reinforces the importance of third-party risk management. Most service provider risk assessments are based on questionnaires or external assessments. This hints that probing deeper to understand the attack paths and asset exposures of the consultancies you work with could yield valuable risk insights.
We can also compare overall security scores based on organization size. One theory is that larger organizations with more resources and mature processes would maintain a stronger security posture (higher scores). An alternate theory is also plausible; large enterprises have large, complex environments that are MORE difficult to manage despite their greater resources.
Which theory is best supported by the evidence? Well, neither. As seen in Figure A2, overall security scores don’t show an increasing or decreasing trend across the size tiers. The cluster of large enterprises with over 100,000 employees exhibits virtually the same score as the smallest companies with staff sizes under 100.
Figure A2: Comparison of overall security scores by organization size
Our takeaway from this is that cybersecurity challenges scale with the organization. Things won’t get inherently easier or harder as your firm grows. Measuring risk to critical assets wherever you’re at now and managing that reality to minimize exposure is imperative for organizations of all sizes.
Our takeaway from this is that cybersecurity challenges scale with the organization. Things won’t get inherently easier or harder as your firm grows. Measuring risk to critical assets wherever you’re at now and managing that reality to minimize exposure is imperative for organizations of all sizes.
Appendix B: Top Cloud Techniques
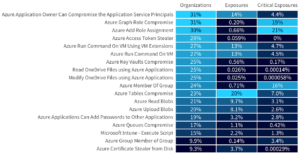
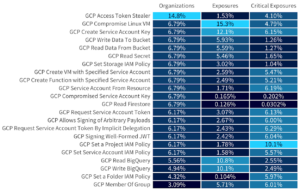
The figures that follow list the top techniques observed by XM Cyber during attack path analyses conducted in 2023. We use the same measures used throughout this report:
- Organizations: Percent of organizations susceptible to each technique
- Exposures: Percent of all platform-specific exposures identified by XM Cyber
- Critical Exposures: Percent of all platform-specific exposures to critical assets
Figure B1: Top techniques in AWS environments
Figure B2: Top techniques in Azure environments
Figure B3: Top techniques in GCP environments
Appendix C: Top ATT&CK Techniques
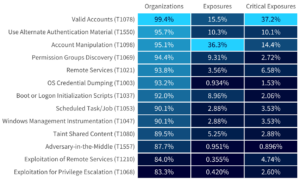
MITRE ATT&CK is a popular knowledge base of adversary tactics, techniques, and procedures (TTPs) used across the cybersecurity industry. Because of this popularity, we maintain a mapping between our attack path techniques and ATT&CK. Based on that mapping, Figure C1 lists the top ATT&CK techniques identified by XM Cyber in 2023.
Figure C1: Top ATT&CK techniques identified by XM Cyber attack path analysis during 2023
Figure C2 compares techniques that expose critical assets in on-prem networks, cloud platforms, and Active Directory. Overall, there’s surprisingly little overlap between the columns. That suggests prioritization of TTPs and defenses should be done specific to the environment in view. It also reiterates the importance of context in threat and risk assessment.
Figure C2: Comparison of critical ATT&CK techniques identified by XM Cyber in different scenarios


